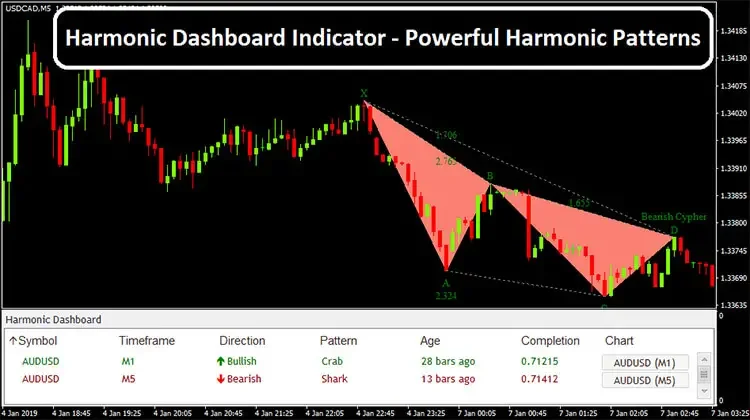
Harmonic patterns are used to detect the reversal conditions of the market. You may find it a little complex while trying to draw it manually on the chart. But this system sets you free from such hassles and detects any possible Harmonic Patterns automatically in live markets. Newbie traders who struggle a lot to detect the pattern correctly can be vastly benefited by applying this system in live charts.
This system uses a dashboard to display any possible detection of Harmonic patterns at any major currency pair chart. Moreover, this system amazingly fits with all kind of timeframe charts (from M1 to W1).
Harmonic Dashboard Indicator – Powerful Harmonic Patterns Overview:
After the installation of this system at the MT4 terminal, your chart will appear like the following image:

Harmonic Dashboard Indicator – Powerful Harmonic Patterns Anatomy:

- Harmonic Dashboard Indicator: It works as a monitor. This dashboard shows any possible formation of Harmonic patterns at any time-frame of any major currency pair. So, you do not need to open multi charts anymore, just keep your eye on the dashboard and be addressed to the right pair at the right time for possible trade opportunities.
- Harmonic Pattern: It uses Fibonacci lines in the background to define the possible turning points of the market momentum and plots geometric price patterns to signal trend reversals. Furthermore, this indicator demonstrates text templates so that you can easily understand the trade signals.
Popular Trading Indicator: CAP Channel Trading Indicator
Harmonic Dashboard: Buy Parameters

- Harmonic Dashboard specifies the currency pair and the time-frame for possible bullish harmonic patterns
- A bullish Harmonic Pattern is plotted at the specified chart
- Buy triggers when the above conditions are met
- Set stop loss below the current range low
- Take profit once a 1:2 risk to reward ratio is achieved
Harmonic Dashboard: Sell Parameters

- Harmonic Dashboard specifies the currency pair and the time-frame for possible bearish harmonic patterns
- A bearish Harmonic Pattern is plotted at the specified chart
- Sell triggers when the above conditions are met
- Set stop loss above the current range high
- Take profit once a 1:2 risk to reward ratio is achieved


I’d like to plot these indicator on a 8H and 2H chart in MT4.
Is this possible?
this indicator has let me get an 310pips win in 2 days, and next day 155 pips win… awesome indicator.. works perfect.
Dear plz send me harmonic software.
The indicator is not available when I try to download it, can you send me?