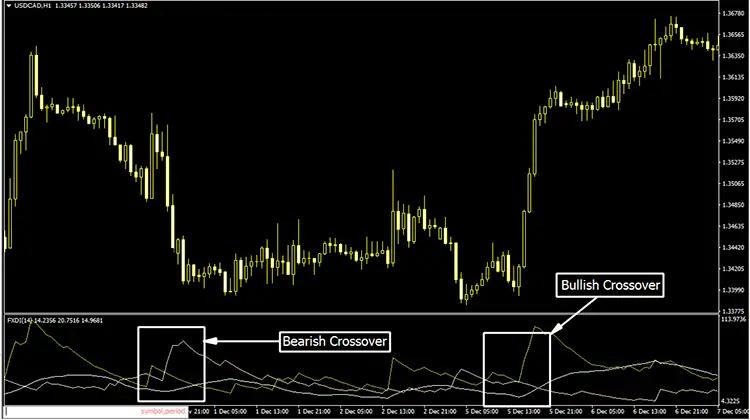
The ADX DMI Indicator is a technical analysis tool that traders use to identify the strength and direction of a trend in the market.
It consists of three lines: the Average Directional Index (ADX), the Positive Directional Index (+DI), and the Negative Directional Index (-DI). The ADX line shows the strength of the trend, while the +DI and -DI lines show the direction of the trend.
When the ADX line is above 25, it indicates that a trend is present, and the higher the ADX value, the stronger the trend.

A reading above 40 is considered a very strong trend. When the +DI line is above the -DI line, it indicates that the trend is bullish, and when the -DI line is above the +DI line, it indicates that the trend is bearish.
Traders often use the ADX DMI indicator in conjunction with other technical analysis tools to confirm their trading decisions.
For example, they may look for a bullish crossover of the 20-period exponential moving average (EMA) with the price, which would confirm a bullish trend.
Conversely, they may look for a bearish crossover of the 20-period EMA with the price to confirm a bearish trend.
Buy Signal Generation With ADX DMI Indicator
When the +DI line crosses above the -DI line, it sends out a buy signal and denotes a potential upward trend reversal.

Furthermore, the ADX line should be above the 25 mark, suggesting a strong trend. A bullish crossover of the 20-period EMA with the price may also be used to confirm a buy signal.
Check Out:
- ABL Indicator (MT4)
- Aroon Oscillator Indicator (MT5)
- Arrows Curves Indicator (MT5)
- ASC Trend Indicator (MT5)
- ASC Trend HTF Signal Indicator (MT5)
Sell Signal Generation With ADX DMI Indicator
A sell signal is generated when the -DI line crosses above the +DI line, indicating a potential trend reversal to the downside.

Additionally, the ADX line should be above the 25 levels, indicating that the trend is strong. Traders may also seek confirmation of a sell signal through a bearish crossover of the 20-period EMA with the price.
