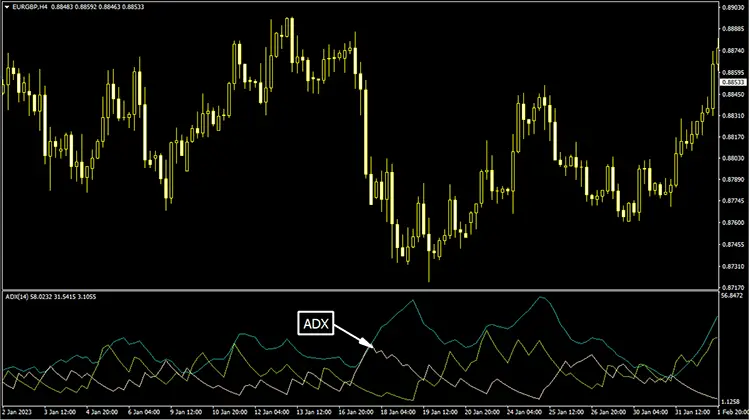
The ADX Lucki Indicator is a technical analysis tool used in Forex trading to measure the strength of a trend. It is based on the Average Directional Index (ADX) indicator, a commonly used tool for identifying trends in the market.
The ADX Lucki indicator is designed to provide traders with a visual representation of the strength of a trend, as well as potential entry and exit points.
The ADX Lucki indicator consists of two lines: the ADX line and the Lucki line. The ADX line represents the trend’s strength, while the Lucki line represents potential entry and exit points.

When the ADX line is above the Lucki line, it indicates that the trend is strong, and traders may want to consider entering or staying in a position. When the lucky line crosses above the ADX line, it signals to exit a position or consider taking profits.
Traders can use the ADX Lucki indicator to identify potential trend reversals and to determine when to enter or exit a position.
Buy Signal Generation With ADX Lucki Indicator
The ADX Lucki Indicator generates a buy signal when its line crosses above the signal line from below, and the +DI line is above the -DI line. Additionally, a bullish crossover of the 20-period EMA with the price can confirm the buy signal.

Another buy signal is generated when the indicator line is above the signal line, and a bullish divergence between the price and the ADX Lucki Indicator is observed. This divergence suggests a weakening downtrend and a potential reversal to the upside.
Check Out:
- ADX DMI Indicator (MT4)
- ACD Pivot Points Indicator (MT4)
- ABL Indicator (MT4)
- Aroon Oscillator Indicator (MT5)
- Arrows Curves Indicator (MT5)
Sell Signal Generation With ADX Lucki Indicator
A sell signal is generated when the ADX Lucki Indicator line crosses below the signal line from above, indicating a potential trend reversal to the downside.

Moreover, the -DI line should be above the +DI line, indicating stronger selling pressure than buying pressure. Traders may also seek confirmation of a sell signal through a bearish crossover of the 20-period EMA with the price.
