The Didi Index is a technical analysis indicator that is used to identify trends in stock price movements. It is based on the idea that changes in trading volume often accompany trends in stock prices.
The Didi Index measures the relationship between the stock price and its trading volume by plotting the difference between the 3-day exponential moving average (EMA) and the 10-day EMA of the stock’s volume. This difference is then plotted on a separate chart beneath the stock’s price chart.
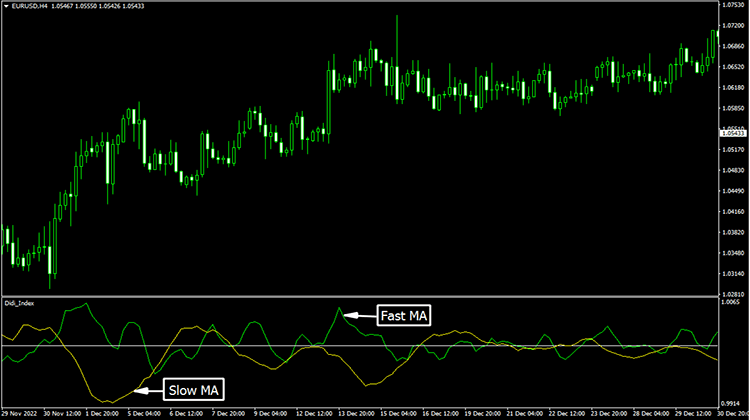
The Didi Index is calculated using a combination of various technical analysis tools, such as moving averages and oscillators. It is displayed as a line on a chart, and traders can use it to identify potential trading opportunities.
The Didi Index helps traders identify the strength of a particular trend. If the index is rising, it may indicate that the trend is strong and that traders should consider entering the market.
Conversely, if the index is falling, it may indicate that the trend is weakening and that traders should consider exiting the market.
Buy Signal Generation with Didi Index Indicator
The Didi Index Indicator can generate a buy signal when it crosses above the signal line. When the Didi Index moves above the signal line, it indicates that the buying pressure is increasing and that the price may continue to rise.

Traders may use this crossover as a confirmation of a bullish trend and consider opening a long position.
Also, check these related articles:
- KAGI 1 Indicator
- I-Sadukey Indicator
- Jurik Trend Strength Indicator
- Elder Impulse System Indicator
- Forex Entry Points Pro Indicator
Sell Signal Generation with Didi Index Indicator
To generate a sell signal using the Didi Index Indicator, traders look for a crossover of the DIDI- signal line below the DIDI+ line.

This indicates that the downtrend is gaining momentum and the price is likely to continue to decline. Additionally, traders may also look for the Didi Index Indicator to move into the overbought zone, above 80, before taking a short position.
